
See who finds your center, and where from.
Visits, sources and booking requests from your public page, in the dashboard. Know whether Google or Instagram brings you new families.
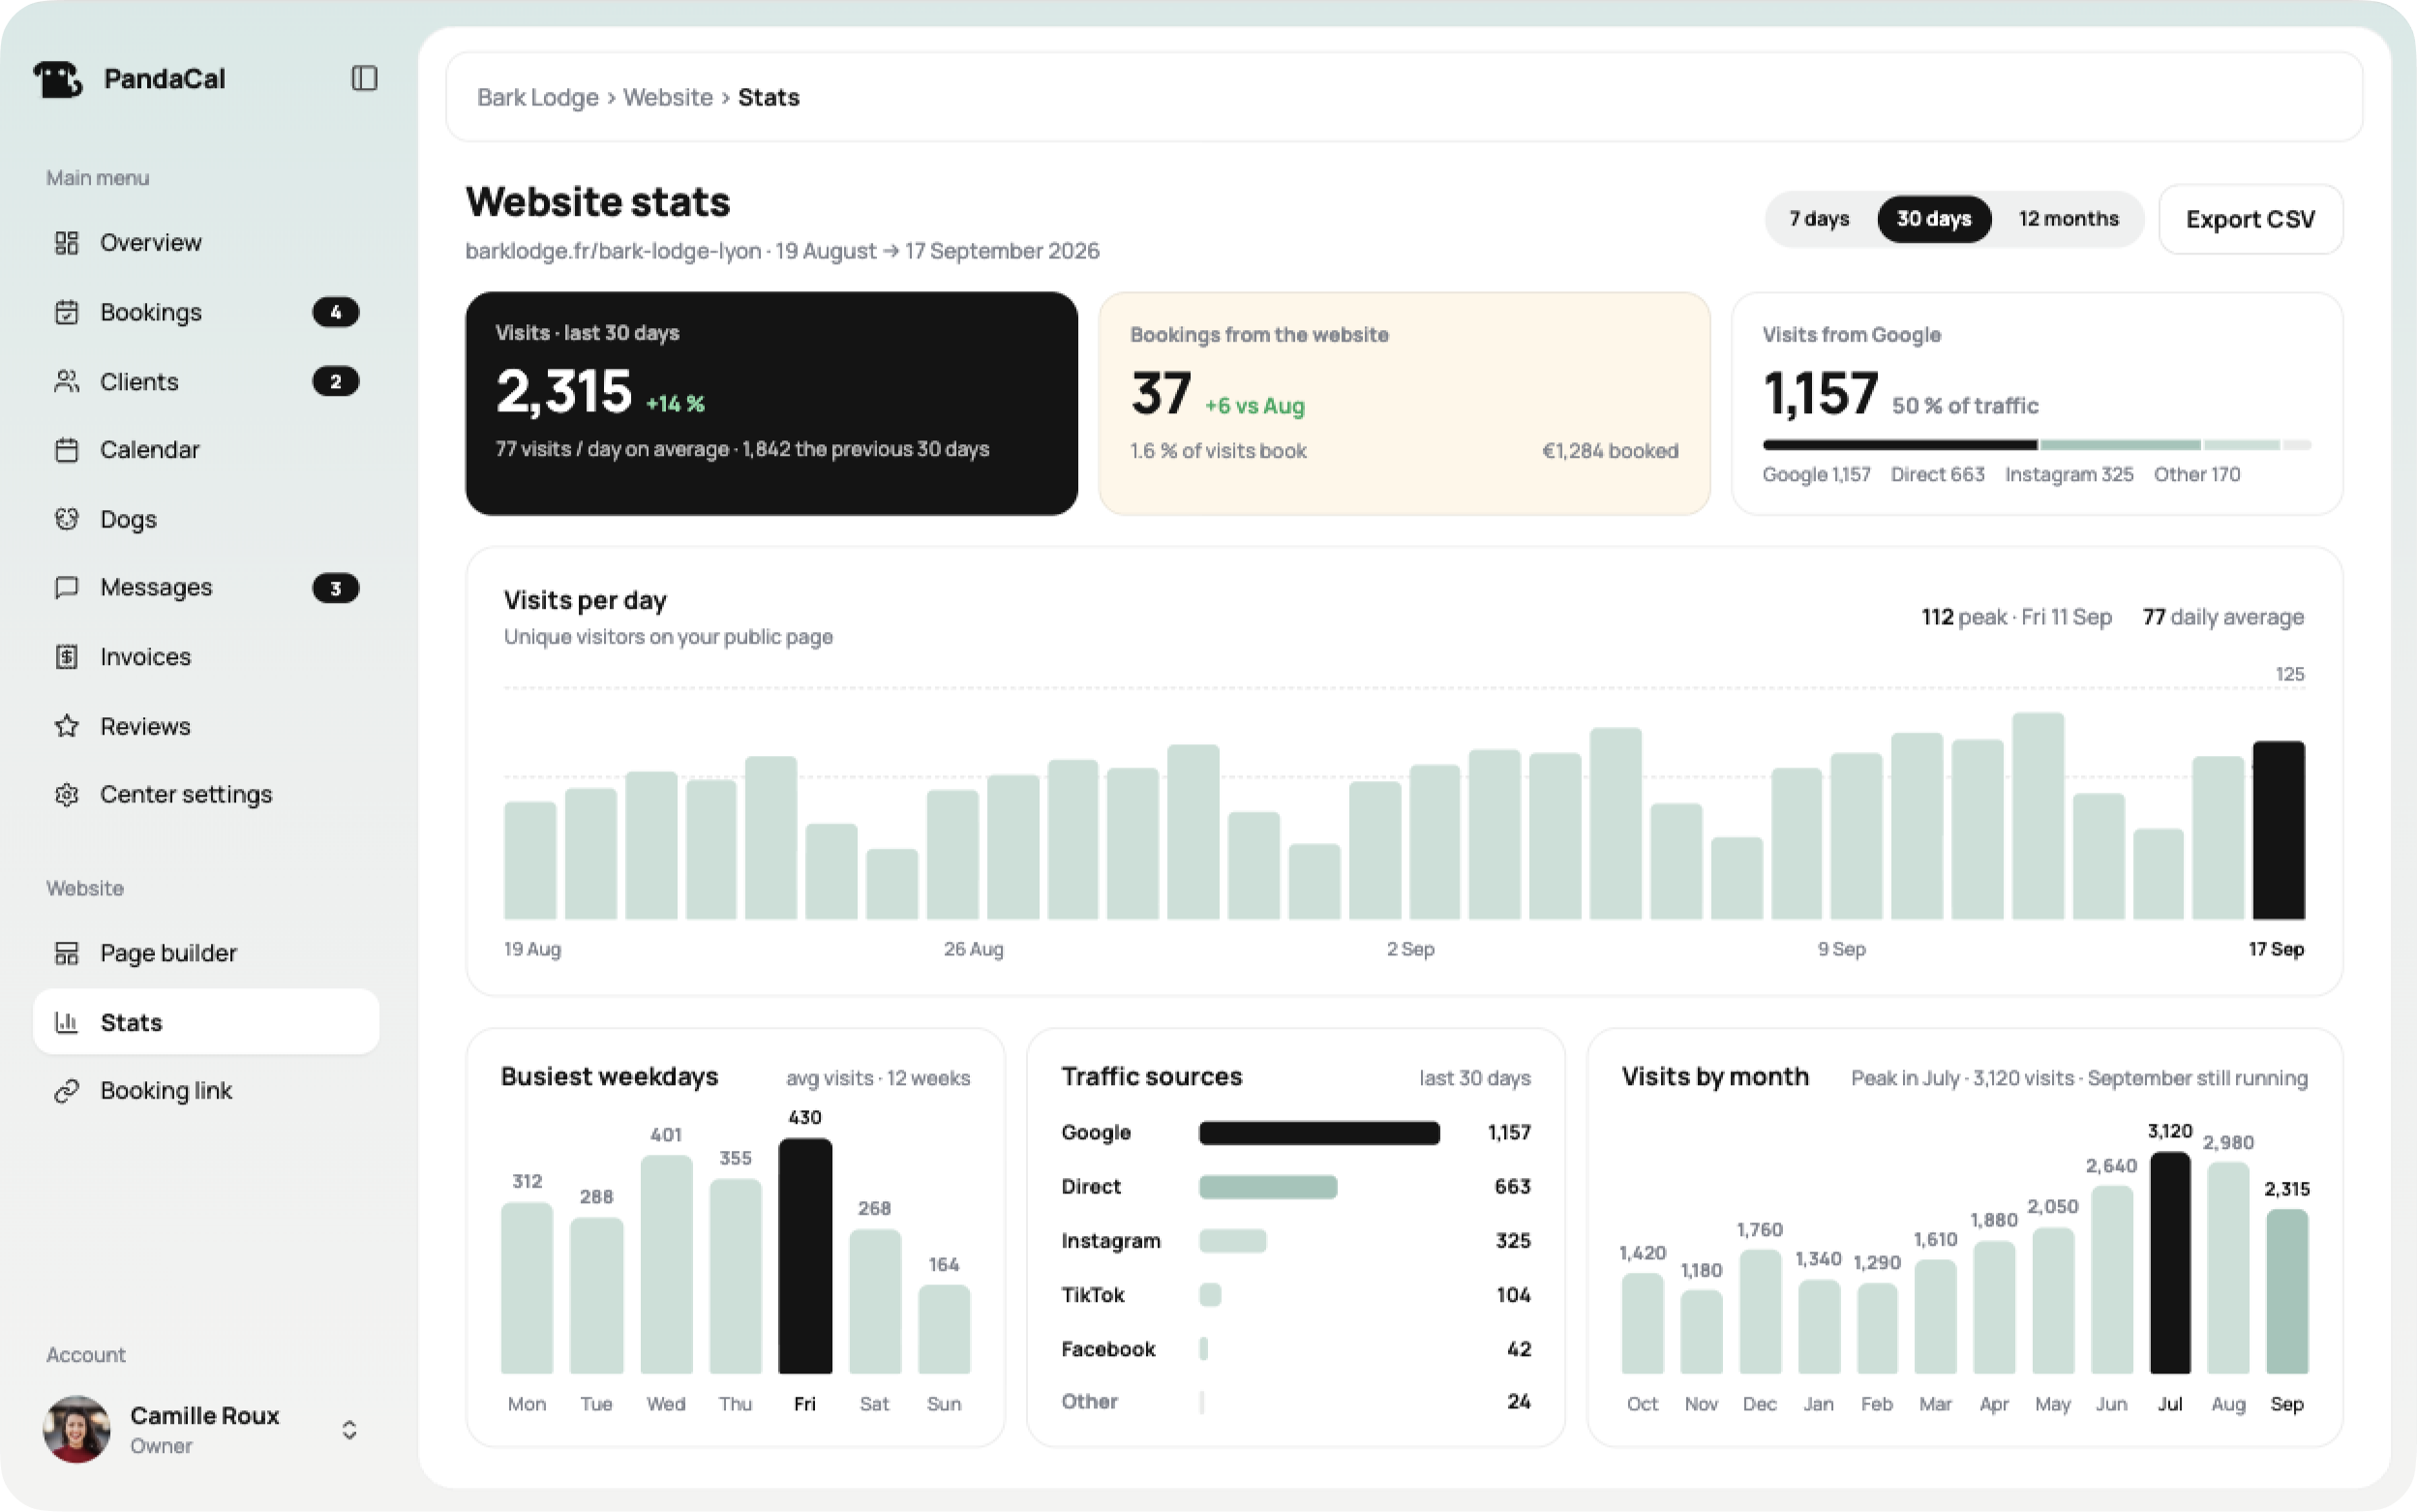
Three numbers that matter.
- 1Visits
How many owners opened your page, day by day, compared with the previous period.
- 2Booking requests
How many booking requests came from your page, and what they are worth.
- 3Conversion
The share of visits that ended in a booking request.
Google, Instagram, TikTok or a direct link.
Each visit is attributed to where it came from. See which channel is worth your time, and which one brings you new families.
See which days bring the most visitors.
A daily chart of unique visitors with your peak day and daily average, over 7 days, 30 days or 12 months. Compare weekdays and months to know when to post or update your page.
See your page grow, month after month.
Track your overall visibility and see in which months people look for you the most. Those may be the moments to concentrate your advertising budget.
Common questions.
Do I need Google Analytics?
No. The statistics are built into PandaCal and work as soon as your page is online.
How do you know where a visit came from?
From the link the visitor came from, or from the tag (utm_source) you add to a link. A visit with no origin is counted as Direct, and one from a site we do not know as Other. Only that one word is kept, never the full address.
How is visitor data handled?
Counting a visit sets no cookie and keeps no name or address: the origin is reduced to one word, and a visitor is a code that changes every day and is deleted after two days. Nothing is linked to a booking.
Can I export the numbers?
Yes, as a CSV file, for the period you are looking at.
Included in the same plan.
Know what brings you new families.
Your first 15 days are free.